Data Selfies
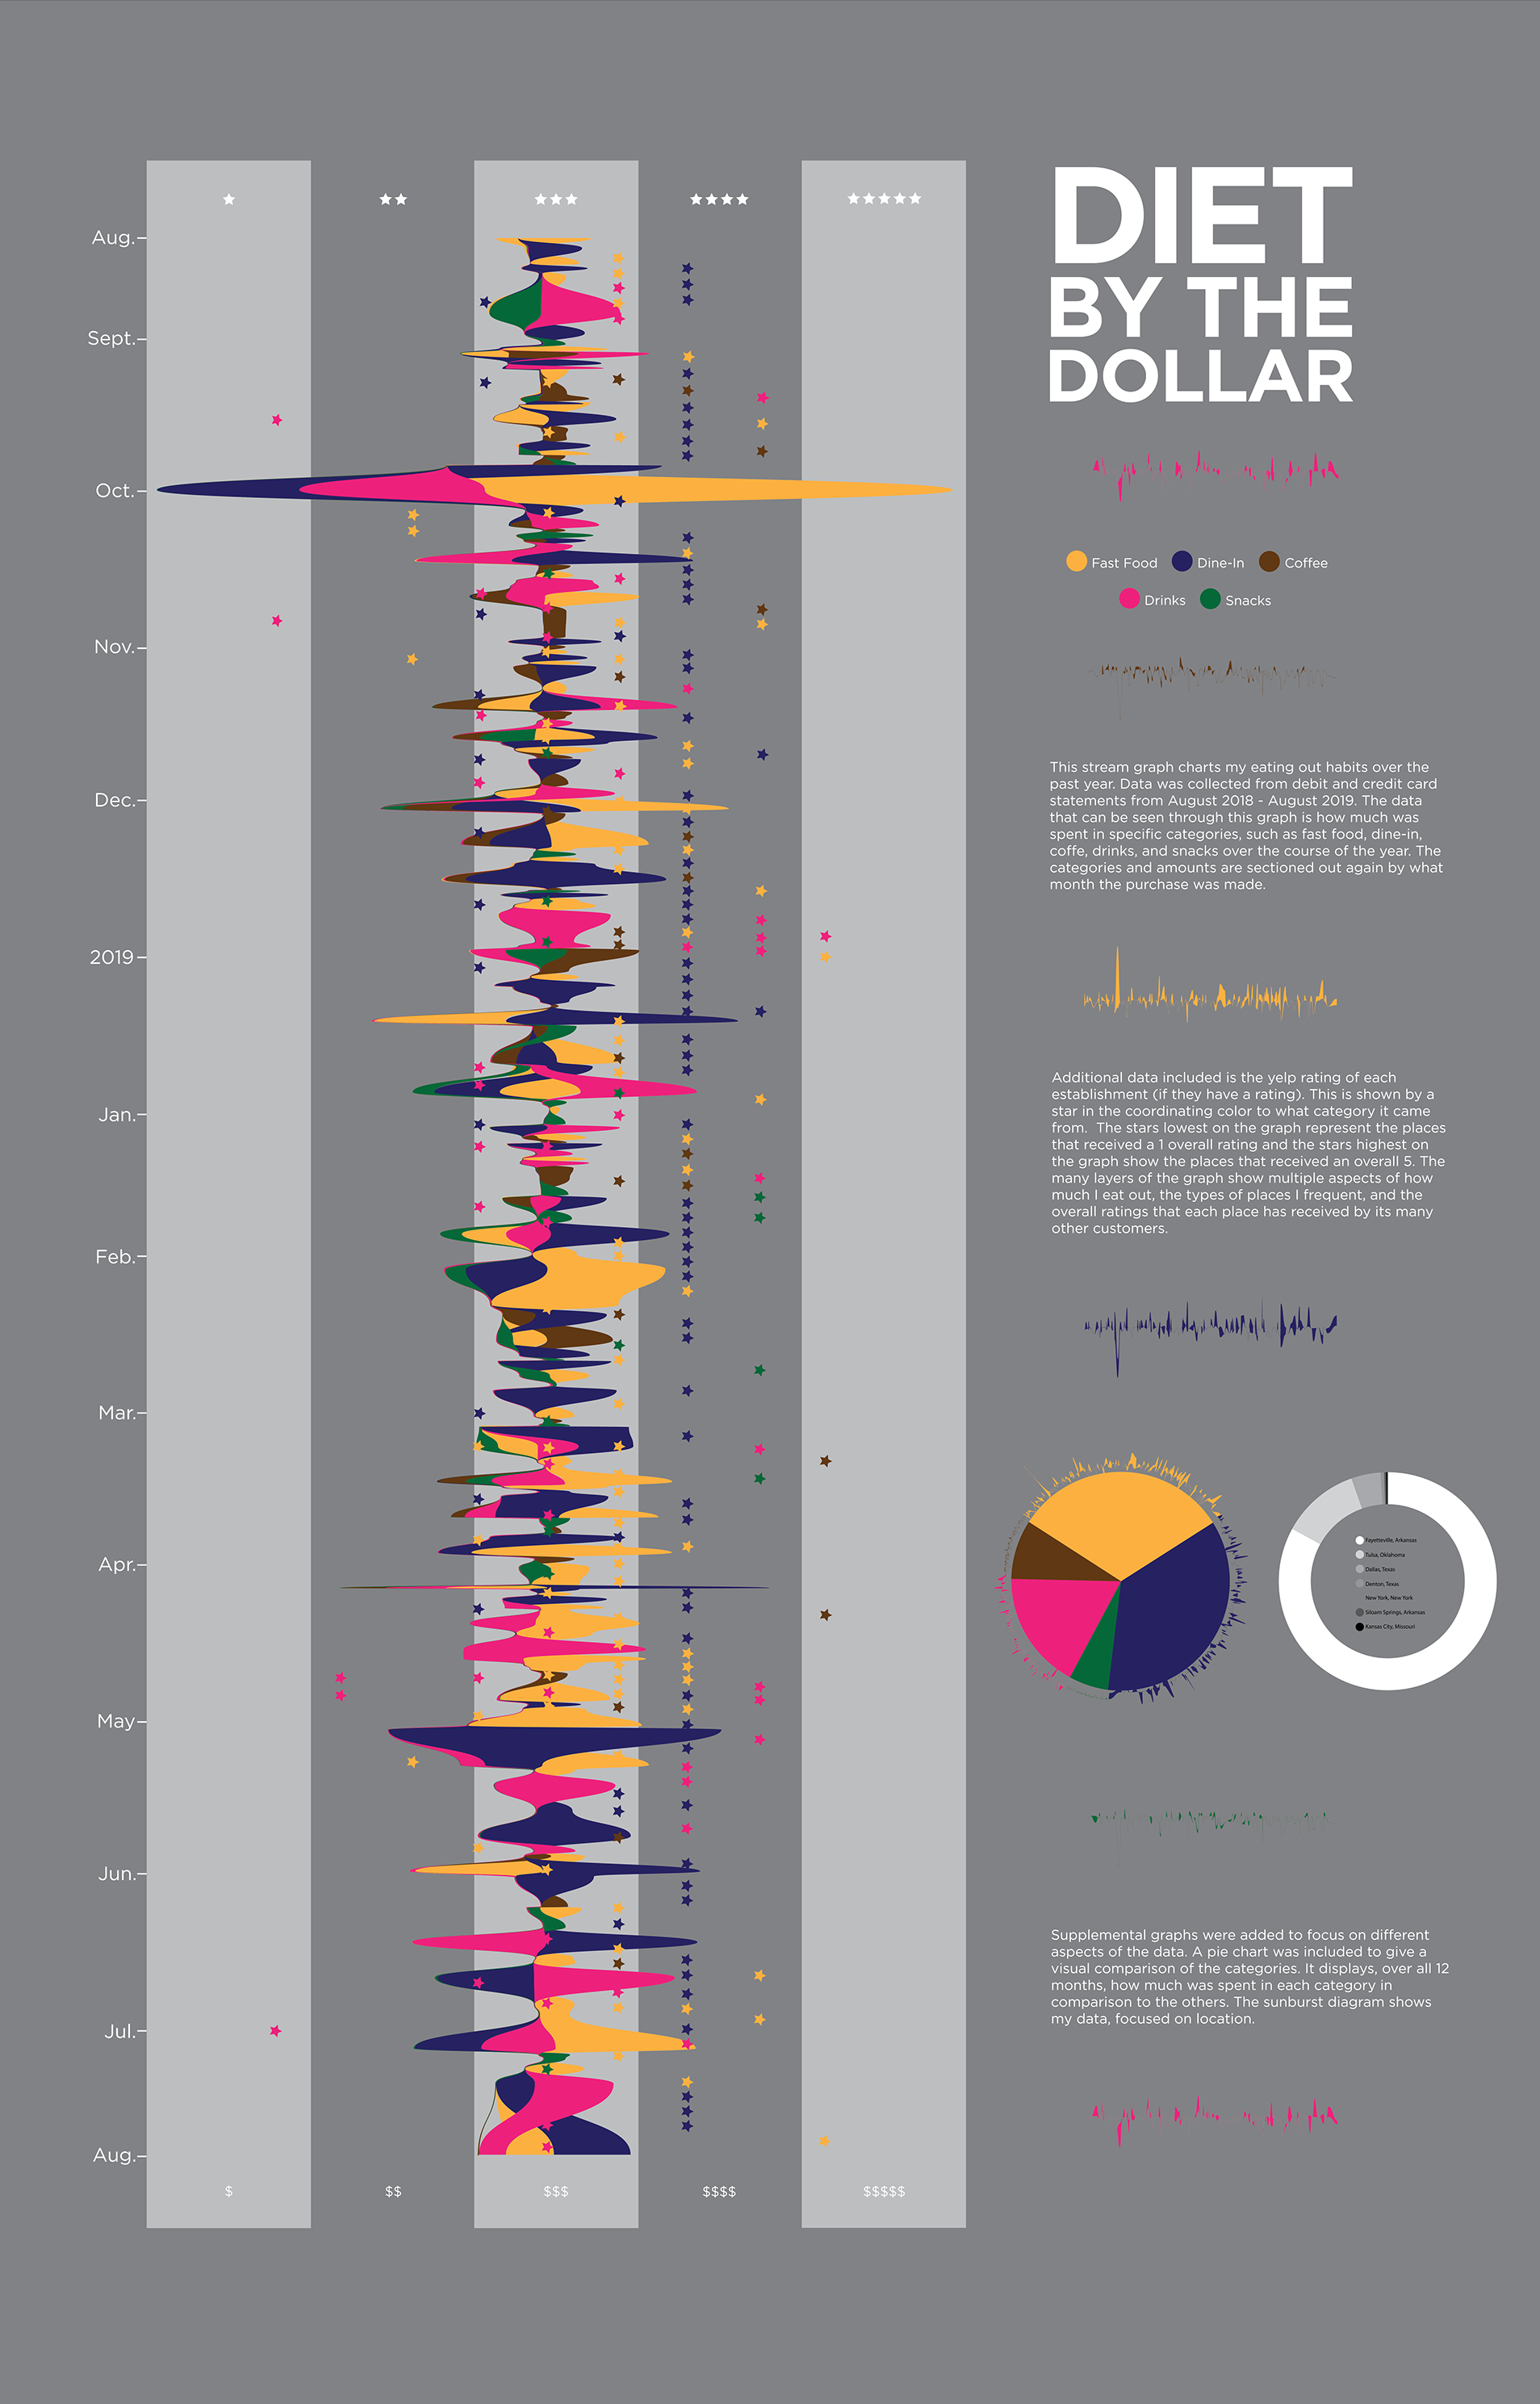
Using data that I collected about myself, I created a visual representation to adequately display the data pulled. The data that is shown in this visual is a year of my dining out habits. I collected all details from my debit/credit cards ranging from where I ate, what day I was charged, what category the restaurant falls under, how much I spent, and even the restaurant’s Yelp review. I displayed that data in a stream graph. This graph was the most visually appealing and most clear depiction of where I was spending the most, whether it was by category or month. Possible ways that viewers could interact with the poster to better understand the data are also included.
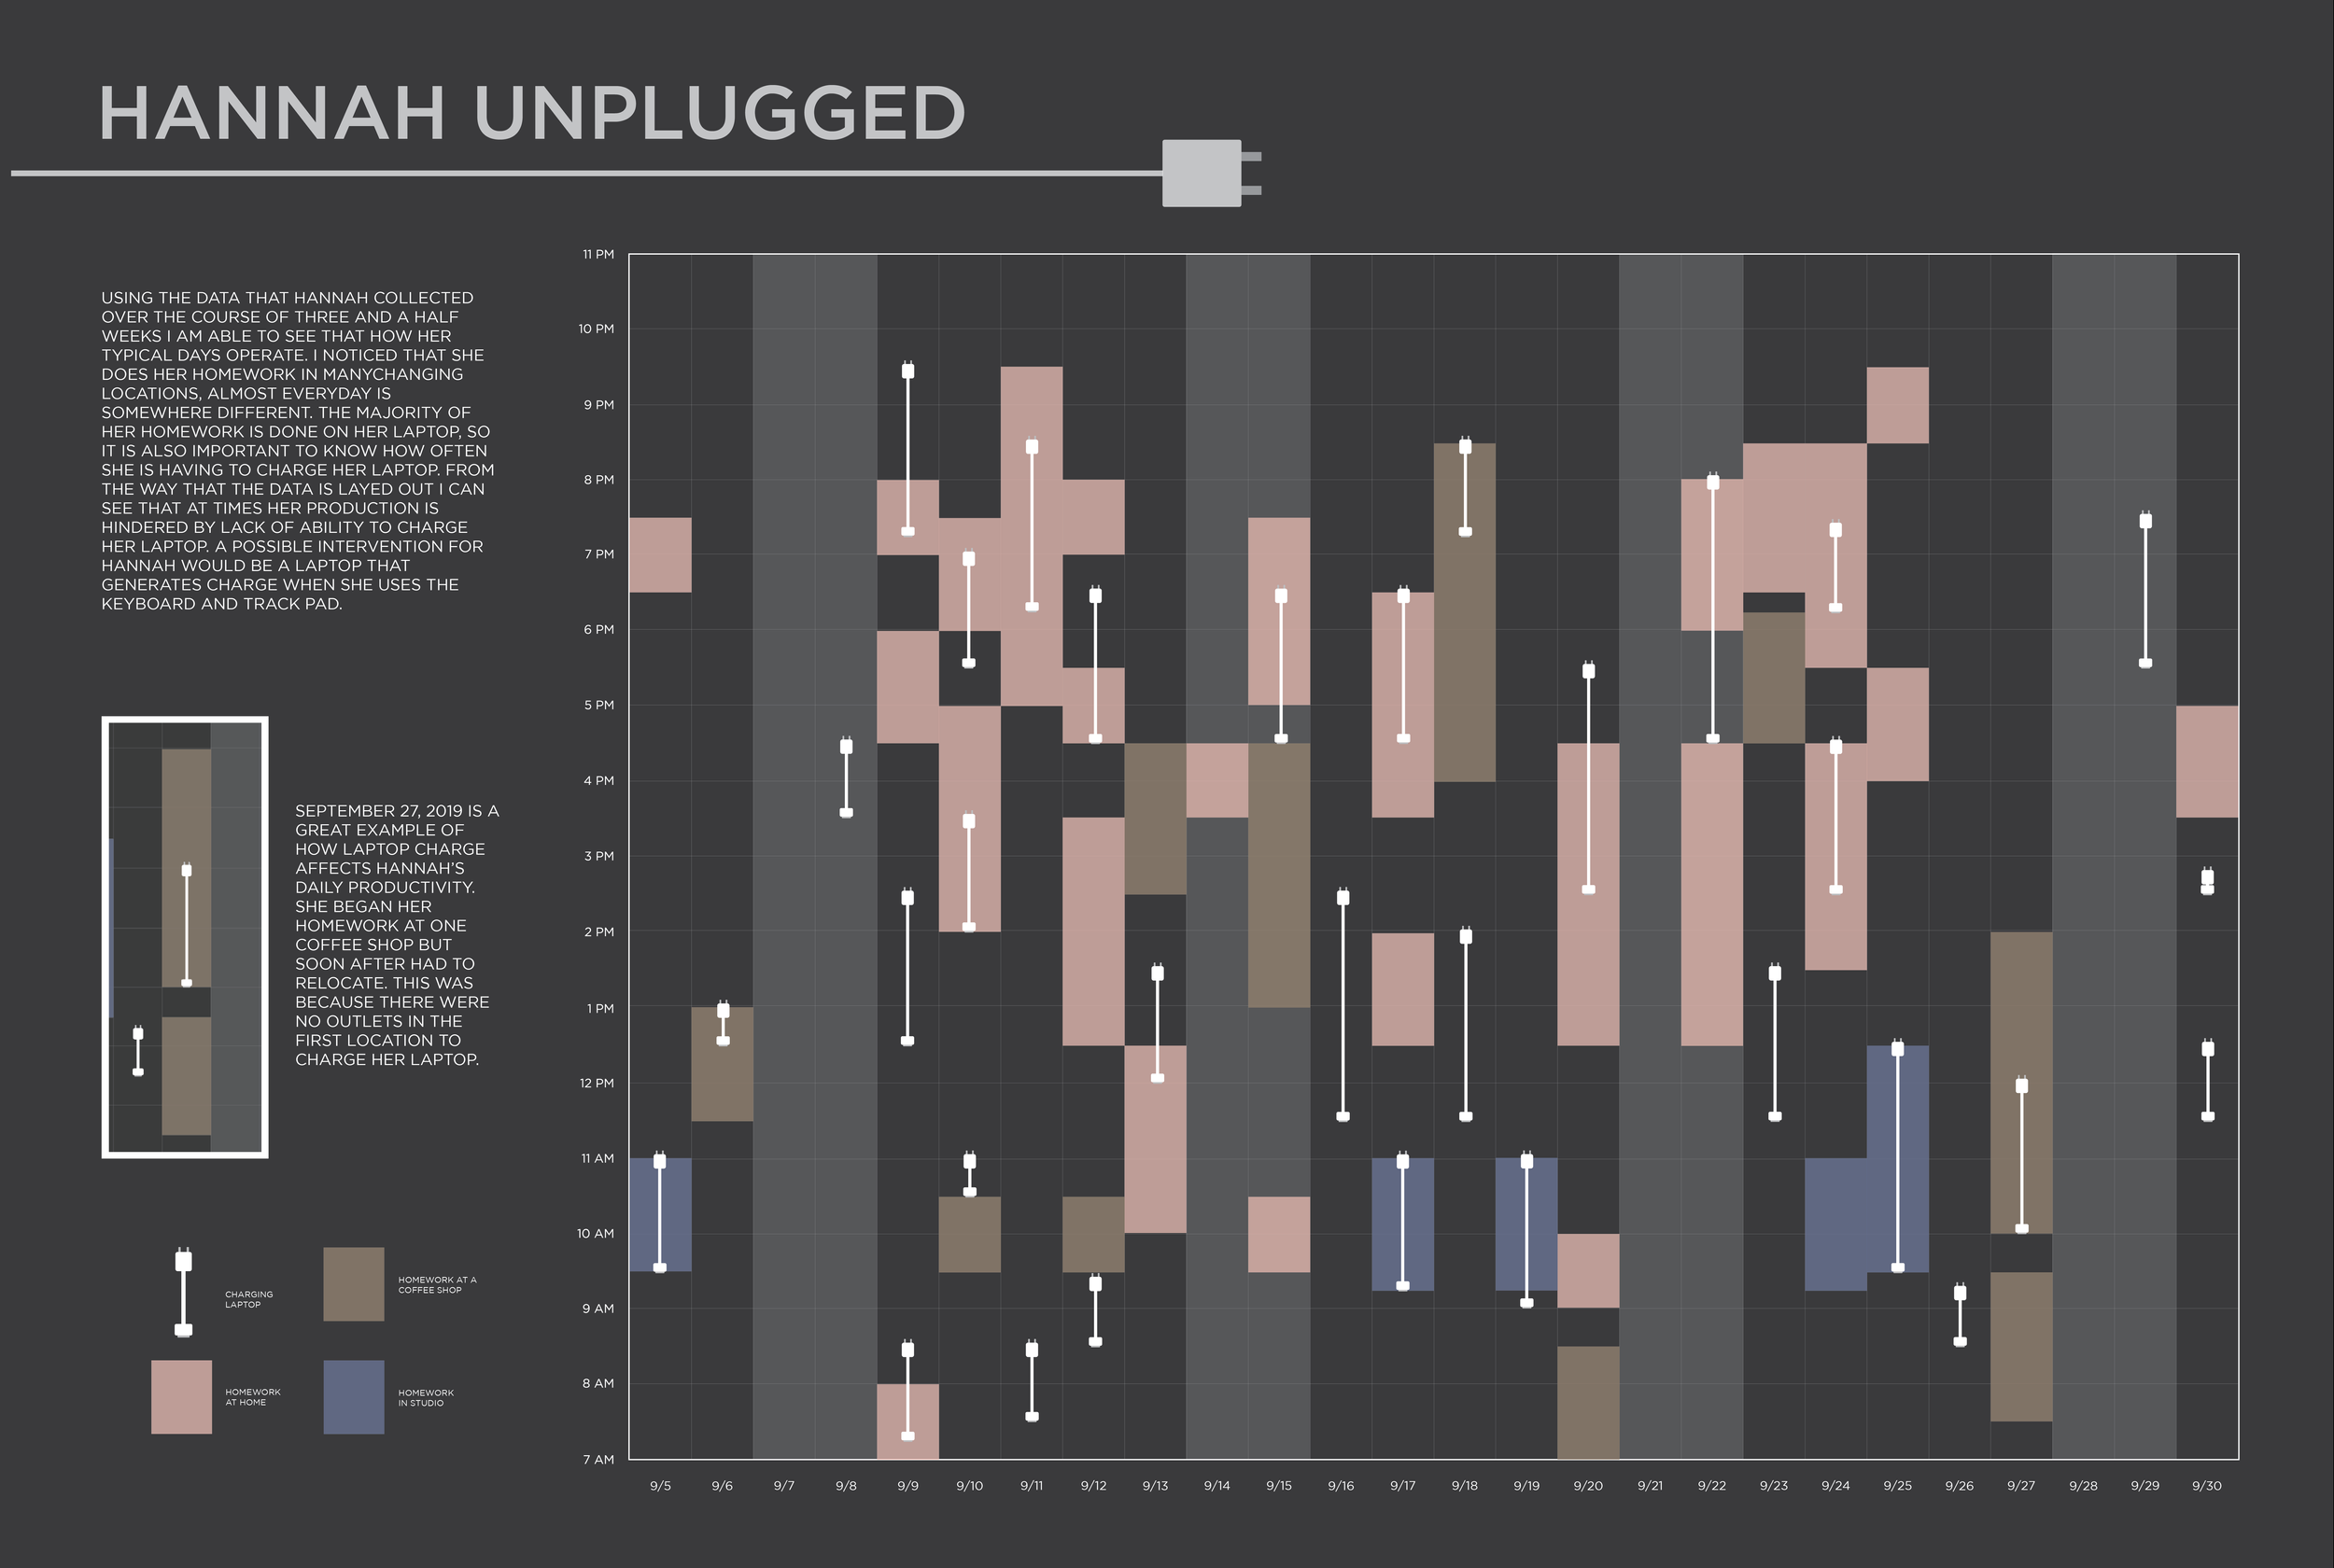
Data Selfie tracked for a classmate over three and a half weeks.